7_cc_mRNA_and_cell_plot
[44]:
import pandas as pd
import scanpy as sc
from tqdm import tqdm
import matplotlib.pyplot as plt
import numpy as np
from scipy.spatial import ConvexHull

import warnings
warnings.filterwarnings('ignore')
[2]:
adata_in = sc.read_h5ad('/mnt/Data16Tc/home/haichao/code/SpaCon/Data/N_20231213_zxw/mouse_3/adata_processed.h5ad')
adata_in.obs
[2]:
| brain_section_label | x | y | z | x_ccf | y_ccf | z_ccf | |
|---|---|---|---|---|---|---|---|
| cell_label | |||||||
| 198904341065180396762707397604803217407 | Zhuang-ABCA-3.023 | 49.206853 | 44.877634 | 12.168155 | 4.920685 | 4.487763 | 1.216815 |
| 252199681526991424029643077826220097990 | Zhuang-ABCA-3.023 | 48.973992 | 44.813761 | 12.179006 | 4.897399 | 4.481376 | 1.217901 |
| 277720971126854564514249564750701518375 | Zhuang-ABCA-3.023 | 48.791066 | 44.577722 | 12.192707 | 4.879107 | 4.457772 | 1.219271 |
| 31551867344111790264292067056219852271 | Zhuang-ABCA-3.023 | 48.830489 | 44.426120 | 12.195078 | 4.883049 | 4.442612 | 1.219508 |
| 131102494428104399865219008178262036485 | Zhuang-ABCA-3.023 | 48.308843 | 43.028156 | 12.267879 | 4.830884 | 4.302816 | 1.226788 |
| ... | ... | ... | ... | ... | ... | ... | ... |
| 318102106429791409781741726367984532777 | Zhuang-ABCA-3.009 | 131.090716 | 69.334275 | 41.436743 | 13.109072 | 6.933427 | 4.143674 |
| 35262847161560382172299767067854387528 | Zhuang-ABCA-3.009 | 131.216032 | 69.494070 | 41.351034 | 13.121603 | 6.949407 | 4.135103 |
| 75415866509570969932943497000463821106 | Zhuang-ABCA-3.009 | 131.415152 | 70.764504 | 40.800403 | 13.141515 | 7.076450 | 4.080040 |
| 12350978322417280063239916106423065862 | Zhuang-ABCA-3.009 | 131.646167 | 71.182557 | 40.595995 | 13.164617 | 7.118256 | 4.059599 |
| 327554758863546024460748891922509519354 | Zhuang-ABCA-3.009 | 131.658892 | 71.414675 | 40.501356 | 13.165889 | 7.141468 | 4.050136 |
1566842 rows × 7 columns
plot
[3]:
section = 'Zhuang-ABCA-3.001'
[4]:
adata_out = sc.read_h5ad(f'/mnt/Data18Td/Data/haichao/merfish_raw_data_zxw3/out_cell_adata/adata_out_cell_distance_q0.3/after_qc/{section}.h5ad')
adata_out
[4]:
AnnData object with n_obs × n_vars = 83602 × 1147
    obs: 'totalRNA', 'brain_section_label', 'x', 'y', 'z', 'n_genes_by_counts', 'total_counts'
    var: 'n_cells_by_counts', 'mean_counts', 'pct_dropout_by_counts', 'total_counts'
    obsm: 'spatial'
[5]:
adata_in_s = adata_in[adata_in.obs['brain_section_label'] == section]
[6]:
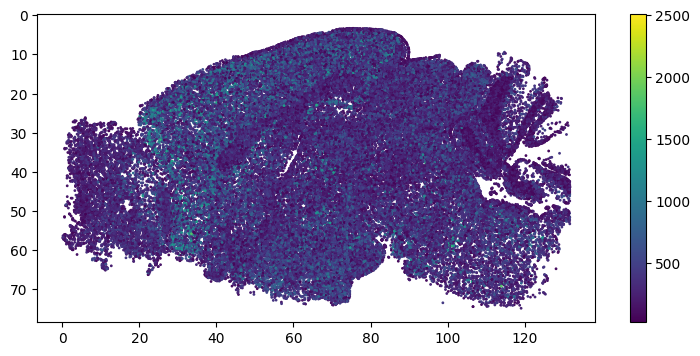
adata_in_s.obs['totalRNA'] = adata_in_s.X.sum(1)
plt.figure(figsize=(9,4))
plt.scatter(adata_in_s.obs['x'], adata_in_s.obs['y'], s=1, c=adata_in_s.obs['totalRNA'])
plt.colorbar()
plt.gca().invert_yaxis()
# plt.savefig('./zxw_section001.png', dpi=600)
cell seg plot
[7]:
k = 'spots_220609_wb3_sa1_1_5z18R_merfish5.csv'
[8]:
path = '/mnt/Data18Td/Data/haichao/merfish_raw_data_zxw3/'
decode = pd.read_csv(path + f'decode/{k}')
decode
[8]:
| barcode_id | global_x | global_y | global_z | x | y | fov | target_gene | |
|---|---|---|---|---|---|---|---|---|
| 0 | 6 | 7431.1514 | -993.20215 | 0.0 | 728.81970 | 1755.30190 | 0 | Blnk |
| 1 | 9 | 7449.9080 | -1056.03990 | 0.0 | 900.89960 | 1178.80870 | 0 | Osr1 |
| 2 | 10 | 7443.4214 | -1027.75560 | 0.0 | 841.38873 | 1438.29750 | 0 | Abca8a |
| 3 | 15 | 7437.5923 | -1014.19040 | 0.0 | 787.91034 | 1562.74840 | 0 | Ndnf |
| 4 | 15 | 7436.9700 | -1010.00200 | 0.0 | 782.20540 | 1601.17430 | 0 | Ndnf |
| ... | ... | ... | ... | ... | ... | ... | ... | ... |
| 118888150 | 1223 | -5469.6436 | -721.12604 | 4.0 | 1638.96030 | 581.68787 | 1459 | Slc6a13 |
| 118888151 | 1227 | -5488.3384 | -749.95166 | 4.0 | 1467.44690 | 317.23276 | 1459 | Ntng1 |
| 118888152 | 1236 | -5468.1800 | -724.55023 | 4.0 | 1652.38230 | 550.27356 | 1459 | Itih5 |
| 118888153 | 1236 | -5464.9087 | -720.48570 | 4.0 | 1682.39610 | 587.56226 | 1459 | Itih5 |
| 118888154 | 1236 | -5464.0776 | -718.31824 | 4.0 | 1690.02310 | 607.44790 | 1459 | Itih5 |
118888155 rows × 8 columns
[9]:
decode_list = []
for z in range(5):
    decode_list.append(decode[decode['global_z'] == z])
decode = pd.concat(decode_list)
decode
[9]:
| barcode_id | global_x | global_y | global_z | x | y | fov | target_gene | |
|---|---|---|---|---|---|---|---|---|
| 0 | 6 | 7431.1514 | -993.20215 | 0.0 | 728.81970 | 1755.30190 | 0 | Blnk |
| 1 | 9 | 7449.9080 | -1056.03990 | 0.0 | 900.89960 | 1178.80870 | 0 | Osr1 |
| 2 | 10 | 7443.4214 | -1027.75560 | 0.0 | 841.38873 | 1438.29750 | 0 | Abca8a |
| 3 | 15 | 7437.5923 | -1014.19040 | 0.0 | 787.91034 | 1562.74840 | 0 | Ndnf |
| 4 | 15 | 7436.9700 | -1010.00200 | 0.0 | 782.20540 | 1601.17430 | 0 | Ndnf |
| ... | ... | ... | ... | ... | ... | ... | ... | ... |
| 118888150 | 1223 | -5469.6436 | -721.12604 | 4.0 | 1638.96030 | 581.68787 | 1459 | Slc6a13 |
| 118888151 | 1227 | -5488.3384 | -749.95166 | 4.0 | 1467.44690 | 317.23276 | 1459 | Ntng1 |
| 118888152 | 1236 | -5468.1800 | -724.55023 | 4.0 | 1652.38230 | 550.27356 | 1459 | Itih5 |
| 118888153 | 1236 | -5464.9087 | -720.48570 | 4.0 | 1682.39610 | 587.56226 | 1459 | Itih5 |
| 118888154 | 1236 | -5464.0776 | -718.31824 | 4.0 | 1690.02310 | 607.44790 | 1459 | Itih5 |
118888155 rows × 8 columns
[10]:
label_list = []
for z in range(5):
    label_tmp = pd.read_csv(f'/mnt/Data16Tc/home/haichao/zhk_cellpose/zxw_mouse3/RNA_assign_result/z{z}_{k}')
    label_list.append(label_tmp)
label = pd.concat(label_list)
label
[10]:
| Unnamed: 0 | cell_id | rna_x | rna_y | |
|---|---|---|---|---|
| 0 | 0 | -1 | 7431.1514 | -993.20215 |
| 1 | 1 | -1 | 7449.9080 | -1056.03990 |
| 2 | 2 | 249036588031381669888723946641009679607 | 7443.4214 | -1027.75560 |
| 3 | 3 | 218848290644972372188932481708465309936 | 7437.5923 | -1014.19040 |
| 4 | 4 | 218848290644972372188932481708465309936 | 7436.9700 | -1010.00200 |
| ... | ... | ... | ... | ... |
| 20701713 | 20701713 | 146425405968477909049602431369064593908 | -5469.6436 | -721.12604 |
| 20701714 | 20701714 | 156289121112150876752838252195691077770 | -5488.3384 | -749.95166 |
| 20701715 | 20701715 | 146425405968477909049602431369064593908 | -5468.1800 | -724.55023 |
| 20701716 | 20701716 | 146425405968477909049602431369064593908 | -5464.9087 | -720.48570 |
| 20701717 | 20701717 | 146425405968477909049602431369064593908 | -5464.0776 | -718.31824 |
118888155 rows × 4 columns
[11]:
decode['cell_id'] = label['cell_id'].values
decode
[11]:
| barcode_id | global_x | global_y | global_z | x | y | fov | target_gene | cell_id | |
|---|---|---|---|---|---|---|---|---|---|
| 0 | 6 | 7431.1514 | -993.20215 | 0.0 | 728.81970 | 1755.30190 | 0 | Blnk | -1 |
| 1 | 9 | 7449.9080 | -1056.03990 | 0.0 | 900.89960 | 1178.80870 | 0 | Osr1 | -1 |
| 2 | 10 | 7443.4214 | -1027.75560 | 0.0 | 841.38873 | 1438.29750 | 0 | Abca8a | 249036588031381669888723946641009679607 |
| 3 | 15 | 7437.5923 | -1014.19040 | 0.0 | 787.91034 | 1562.74840 | 0 | Ndnf | 218848290644972372188932481708465309936 |
| 4 | 15 | 7436.9700 | -1010.00200 | 0.0 | 782.20540 | 1601.17430 | 0 | Ndnf | 218848290644972372188932481708465309936 |
| ... | ... | ... | ... | ... | ... | ... | ... | ... | ... |
| 118888150 | 1223 | -5469.6436 | -721.12604 | 4.0 | 1638.96030 | 581.68787 | 1459 | Slc6a13 | 146425405968477909049602431369064593908 |
| 118888151 | 1227 | -5488.3384 | -749.95166 | 4.0 | 1467.44690 | 317.23276 | 1459 | Ntng1 | 156289121112150876752838252195691077770 |
| 118888152 | 1236 | -5468.1800 | -724.55023 | 4.0 | 1652.38230 | 550.27356 | 1459 | Itih5 | 146425405968477909049602431369064593908 |
| 118888153 | 1236 | -5464.9087 | -720.48570 | 4.0 | 1682.39610 | 587.56226 | 1459 | Itih5 | 146425405968477909049602431369064593908 |
| 118888154 | 1236 | -5464.0776 | -718.31824 | 4.0 | 1690.02310 | 607.44790 | 1459 | Itih5 | 146425405968477909049602431369064593908 |
118888155 rows × 9 columns
[118]:
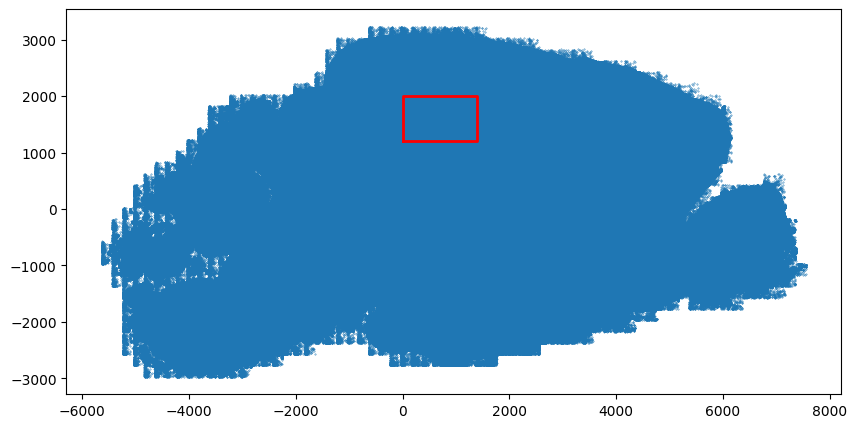
decode1 = decode[decode['global_z'] == 0]
plt.figure(figsize=(10,5))
plt.scatter(decode1['global_x'], decode1['global_y'], s=0.1)
# Define the boundary of the rectangle
# x_min, x_max = 0, 2100
# y_min, y_max = 1200, 1900

x_min, x_max = 0, 1400
y_min, y_max = 1200, 2000

# x_min, x_max = 1000, 1300
# y_min, y_max = 1400, 1600
# x_min, x_max = 1000, 1400
# y_min, y_max = 1350, 1550
# Four vertices of rectangular
rect_x = [x_min, x_max, x_max, x_min, x_min]
rect_y = [y_min, y_min, y_max, y_max, y_min]
# Draw the rectangular boundary
plt.plot(rect_x, rect_y, color='red', linewidth=2)
[118]:
[<matplotlib.lines.Line2D at 0x7f3c8efc4100>]
[119]:
th = decode[(decode['global_x'] >x_min) &((decode['global_x'] <x_max)) & (decode['global_y'] >y_min) &((decode['global_y'] <y_max))]
th_out = th[th['cell_id'] == '-1']
th_in = th[th['cell_id'] != '-1']
th_out
[119]:
| barcode_id | global_x | global_y | global_z | x | y | fov | target_gene | cell_id | |
|---|---|---|---|---|---|---|---|---|---|
| 53389403 | 13 | 1389.816000 | 1826.8329 | 0.0 | 349.59702 | 104.246605 | 610 | Lamp5 | -1 |
| 53389409 | 13 | 1377.533300 | 1835.3567 | 0.0 | 236.91116 | 182.447480 | 610 | Lamp5 | -1 |
| 53389414 | 13 | 1384.640400 | 1855.5872 | 0.0 | 302.11380 | 368.047300 | 610 | Lamp5 | -1 |
| 53389421 | 13 | 1371.650600 | 1863.4064 | 0.0 | 182.94237 | 439.783450 | 610 | Lamp5 | -1 |
| 53389431 | 13 | 1382.553200 | 1883.7363 | 0.0 | 282.96545 | 626.296630 | 610 | Lamp5 | -1 |
| ... | ... | ... | ... | ... | ... | ... | ... | ... | ... |
| 74074183 | 1236 | 92.978540 | 1863.2688 | 4.0 | 1296.04160 | 438.521670 | 837 | Itih5 | -1 |
| 74074185 | 1236 | 105.203530 | 1954.1355 | 4.0 | 1408.19750 | 1272.160500 | 837 | Itih5 | -1 |
| 74074187 | 1236 | 103.284550 | 1969.9293 | 4.0 | 1390.59230 | 1417.058100 | 837 | Itih5 | -1 |
| 74074190 | 1237 | 24.977634 | 1992.4144 | 4.0 | 672.18020 | 1623.344200 | 837 | blank-167 | -1 |
| 74074191 | 1239 | 144.565660 | 1886.0315 | 4.0 | 1769.31810 | 647.353450 | 837 | blank-169 | -1 |
1637702 rows × 9 columns
[121]:
import random
xy = th_in[['global_x', 'global_y']].values
groups = th_in['cell_id'].values
# Get the unique group
unique_groups = np.unique(groups)
# Set color
# colors = ['#43978F', '#9EC4BE', '#ABD0F1', '#DCE9F4', '#E56F5E', '#F19685', '#F6C957', '#FFB77F', '#FBE8D5']
# colors = ['#427AB2', '#F09148', '#FF9896', '#DBDB8D', '#C59D94', '#AFC7E8']
# colors = ["#6bad6b"]
# Set drawing
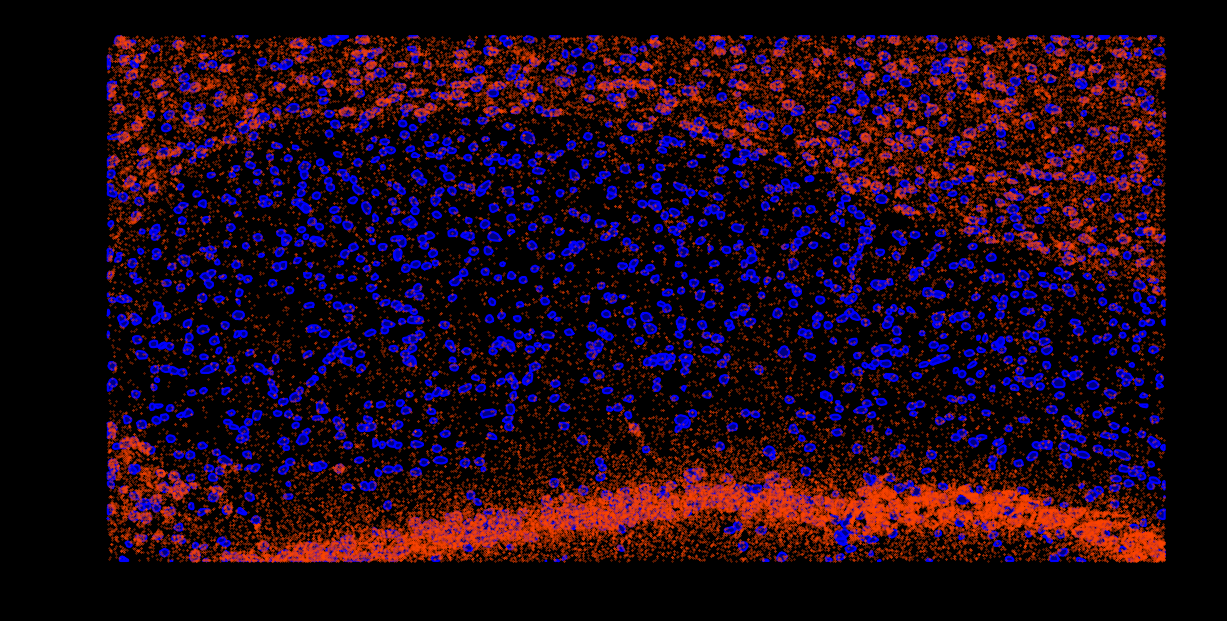
fig, ax = plt.subplots(figsize=(15,7.5))
fig.patch.set_facecolor('black') # Set graphical background color
ax.set_facecolor('black') # Set the background color of the coordinate axis
# Calculate the convex bag of each group and draw
for group in tqdm(unique_groups):
# Extraction belongs to this group
points = xy[groups == group]
# Remove the duplication point
points = np.unique(points, axis=0)
# The number of points in the inspection group requires at least 3 points to calculate the convex bag
if points.shape[0] < 3:
print(f"Skipping group {group} due to insufficient points ({points.shape[0]} points)")
continue
# Convert points to floating -point type
points = points.astype(float)
# Calculating convex bag
hull = ConvexHull(points)
# Get the apex of convex bag
hull_points = points[hull.vertices]
# Draw the folding and filling of the convex bag
plt.plot(np.append(hull_points[:, 0], hull_points[0, 0]),
np.append(hull_points[:, 1], hull_points[0, 1]), color='blue', linestyle='-')
# Fill the inside of the convex bag
plt.fill(hull_points[:, 0], hull_points[:, 1], color='blue', alpha=0.5)
x = th[['global_x', 'global_y']].values[:, 0]
y = th[['global_x', 'global_y']].values[:, 1]
labels = th['target_gene'].values
# genes=['Sv2b', 'Satb2', 'Neurod2', 'Neurod6']
genes = ['Slc17a7', 'Fgf13', 'Calb1']
for gene in genes:
x_a = [x[i] for i in range(len(labels)) if labels[i] in gene]
y_a = [y[i] for i in range(len(labels)) if labels[i] in gene]
# Draw a scattered point map
plt.scatter(x_a, y_a, color='#FF4500', s=0.08, label='a', zorder=10, marker='o') # Tags a point of A
# plt.savefig('cell_seg_mrna.png', dpi=600)
40%|████ | 765/1905 [00:09<00:14, 78.26it/s]
Skipping group 221281312322036888133953509642918615095 due to insufficient points (2 points)
91%|█████████ | 1735/1905 [00:22<00:01, 86.31it/s]
Skipping group 69904789184529410098916752207953295576 due to insufficient points (1 points)
96%|█████████▋| 1835/1905 [00:23<00:00, 87.43it/s]
Skipping group 85597928504424692559439686832524183758 due to insufficient points (1 points)
100%|██████████| 1905/1905 [00:24<00:00, 76.94it/s]